

0
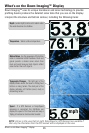
Owner's of the Humminbird Marine GPS System Di Combo gave it a score of 0 out of 5. Here's how the scores stacked up:
22
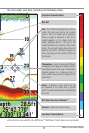
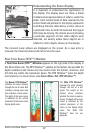
Understanding the Sonar Display
It is important to understand the significance of
the display. The display does not show a literal
3-dimensional representation of what is under the
water. Each vertical band of data received by the
control head and plotted on the display represents
something that was detected by a sonar return at
a particular time. As both the boat and the targets
(fish) may be moving, the returns are only showing
a particular segment of time when objects were
detected, not exactly where those objects are in
relation to other objects shown on the display.
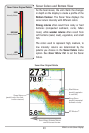
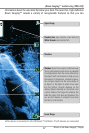
The returned sonar echoes are displayed on the screen. As a new echo is
received, the historical data scrolls left across the view.
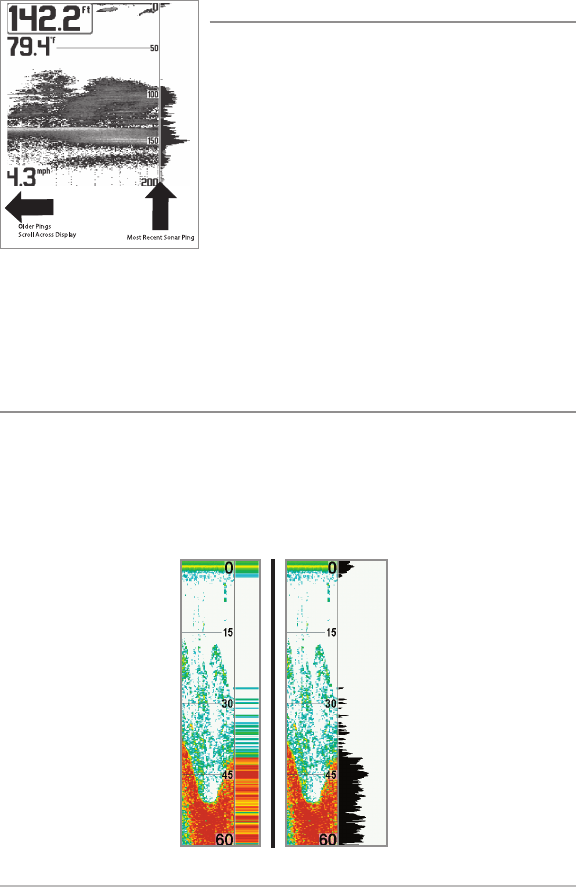
Real Time Sonar (RTS™) Window
A Real Time Sonar (RTS™) Window appears on the right side of the display in
the Sonar View only. The RTS Window™ updates at the fastest rate possible for
depth conditions and shows only the returns from the bottom, structure, and
fish that are within the transducer beam. The RTS Window™ plots the depth
and intensity of a sonar return (see Sonar Menu Tab: RTS Window™).
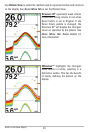
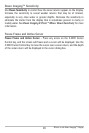
The Narrow RTS Window™
indicates the sonar intensity
throughtheuseofcolors.Red
indicates a strong return and
blue indicates a weak return.
The depth of the sonar return
is indicated by the vertical
placementofthereturnonthe
display depthscale.
The Wide RTS Window™
indicates the sonar intensity
through the use of a bar
graph. The length of the
plotted return indicates
whether the return is weakor
strong. Thedepthofthesonar
return is indicated by the
vertical placement of the
return on the display depth
scale. The Wide RTS
Window™ does not use
grayscale.
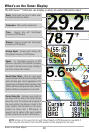
What’s onthe Sonar Display


Find Your Products By Category
- Communications
- Photography
- Portable Media
- Home Audio
- Kitchen Appliance
- Computer Equipment
- TV and Video
- Cell Phone
- Household Appliance
- Video Game
- Laundry Appliance
- Musical Instruments & Equipment
- Power Tools
- Automotive
- Car Audio and Video
- Outdoor Cooking
- Marine Equipment
- Lawn and Garden
- Personal Care
- Fitness & Sports
- Baby
Please Login
