
0
Owner's of the APC Home Security System NetBotz gave it a score of 0 out of 5. Here's how the scores stacked up:

16NetBotz Appliance User’s Guide
Sensor Data Pane
Located in the lower-left hand corner of the interface, the Sensor Data pane displays the readings and
alert status of sensors associated with the selected device in the Navigation pane. If the selected device is
an output relay device, the state of the relay is displayed.
If the selected device features a large number of sensors, the sensors may be divided into sensor sets. Use
the Set drop-down list to select either a specific sensor set or All Sensors.
Right-clicking on a sensor in the Sensor Data Pane reveals a drop-down menu with the following
options:
• Configure sensor...
Select this option to display the Sensor Configuration window, where you can modify the
settings and thresholds for the available sensors.
• View graph
Select this option to display the Graph View pre-populated with the current sensor.
• View History
Select this option to display the History View pre-populated with the current sensor.
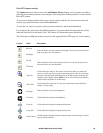
Action/Information Pane
Use the Action/Information pane, located on the right-hand side of the interface, to view information and
perform configuration tasks on your appliance and pods. The following views are available from the
Action/Information pane:
• Camera View: This view displays live video captured by the appliance, cameras connected to the
appliance, or IP cameras on your network that are shared through the appliance. You can listen to
an audio stream from a selected camera pod or CCTV adapter pod and transmit audio from a
microphone connected to a computer running Advanced View to a selected camera pod or CCTV
adapter pod. If relay outputs are associated with a camera pod, buttons for each switch or relay
appear on the camera image to which they correspond.
See “Output Control” on page 53.
• Alerts View: This view displays alerts and resolved alerts reported by the appliance, any pods
connected to the appliance, or any devices being monitored by scanners.
• Maps View: This view displays maps that you configure for use with the appliance. A device with
a red background has an alert status. A device with a green background has a status of OK.
• Graph View: This view displays a graph of up to 24 hours of environmental data collected from
any sensors or devices associated with an appliance.
• History View: This view displays a historical set of data for a chosen appliance or sensor set. This
data can be exported to a text file for import into another application.
• Configuration View: Use this view to configure your appliance, pods connected to the appliance,
and sensors, plus various other system settings and features.
• About View: This view displays information about your appliance and all connected pods.


Find Your Products By Category
- Communications
- Photography
- Portable Media
- Home Audio
- Kitchen Appliance
- Computer Equipment
- TV and Video
- Cell Phone
- Household Appliance
- Video Game
- Laundry Appliance
- Musical Instruments & Equipment
- Power Tools
- Automotive
- Car Audio and Video
- Outdoor Cooking
- Marine Equipment
- Lawn and Garden
- Personal Care
- Fitness & Sports
- Baby
Please Login
